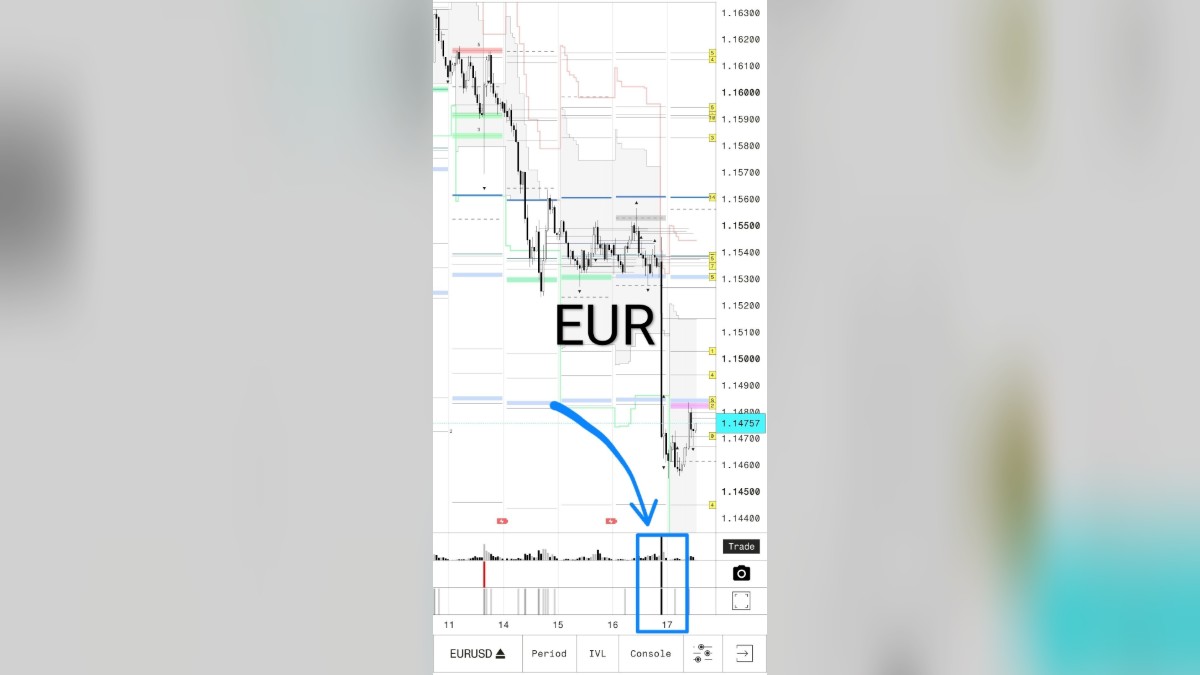
This continues the post about the book (see post before). Let's break down a climax move case, similar to the turpentine stocks story:
Market climax phase: NZDUSD case, May 2021
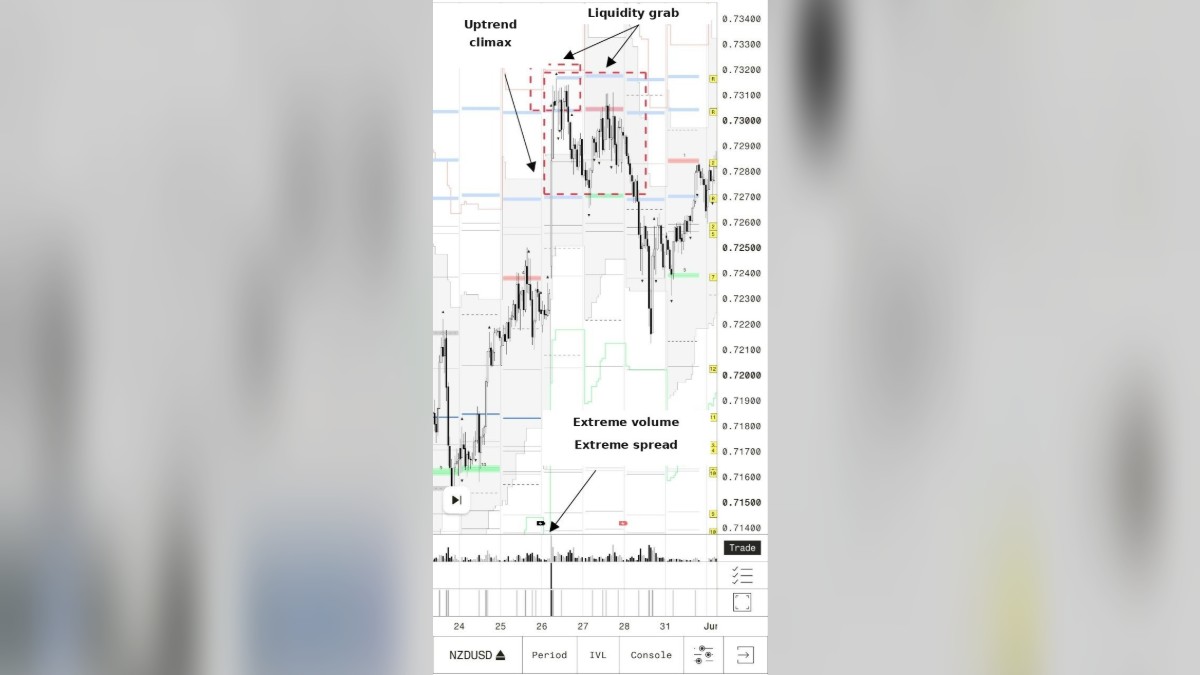
In late May 2021, NZDUSD broke out of its average daily volatility range. Price surged, took out local highs, and grabbed liquidity above the level.
On the 2:00 GMT candle, two signals appeared at once: extreme volume and extreme spread. The trigger was an official RBNZ release confirming the OCR held at 0.25% and continued stimulus policy.
Price ended up breaking the liquidity level, pulling in breakout buyers, and then grabbing their liquidity too. The rally never continued from there: NZDUSD reversed and declined for almost three weeks.
Open UniqUnits and check what climax moves look like on your own instruments. Keep an eye on NZDUSD too, similar fundamental data came out on 09/02/26.
Track the data flow and real-time liquidity reaction through our app: