A regular trader doesn't see what a market maker sees: the full depth of the order book, every active order, the structure of large positions.
There's simply no way to directly measure how much liquidity is sitting at a given level.
A level by itself is just a line on a chart. What actually gives it meaning is how price has behaved there.
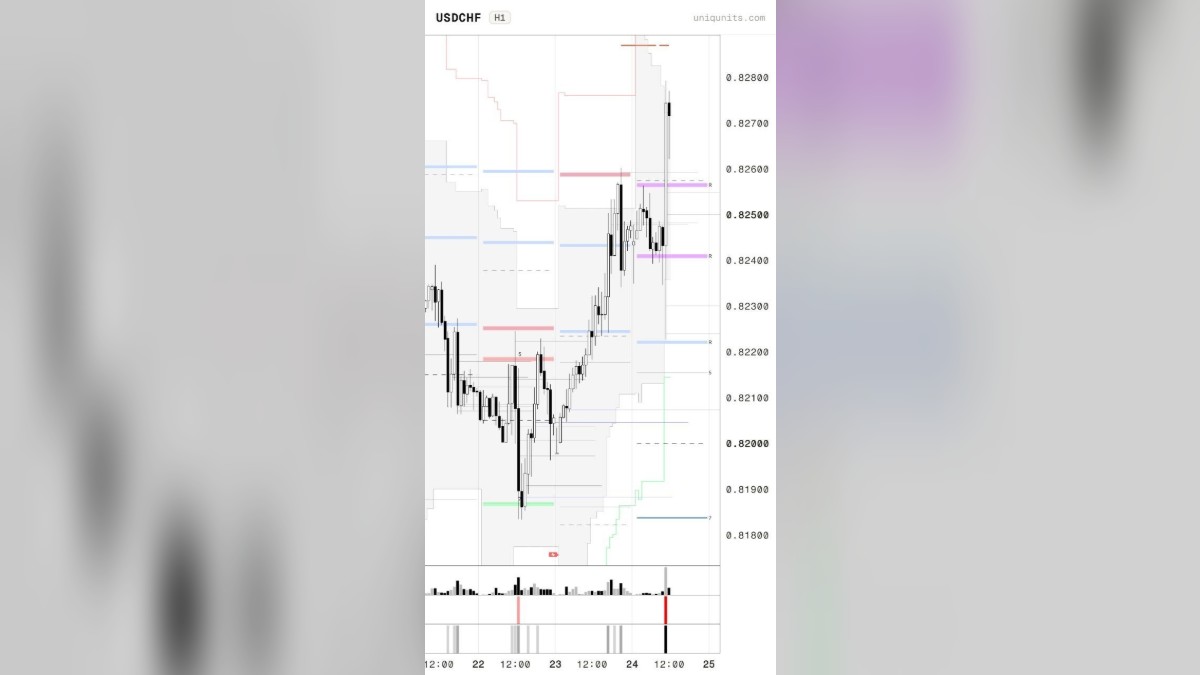
In UniqUnits, the algorithm shows you the character of that reaction right away:
🟩 Green — a buying reaction
🟥 Red — a selling reaction
🟣 Purple — the reaction is still forming, the hour hasn't closed yet. It's a signal that activity is starting to build at the level, but there's no final confirmation yet.
⚠️ The hourly candle closing is a hard requirement. That's what confirms the reaction actually formed, and protects you from jumping in on candle wicks that can still shift dramatically before the hour ends.
Track the data flow and real-time liquidity reaction through our app: