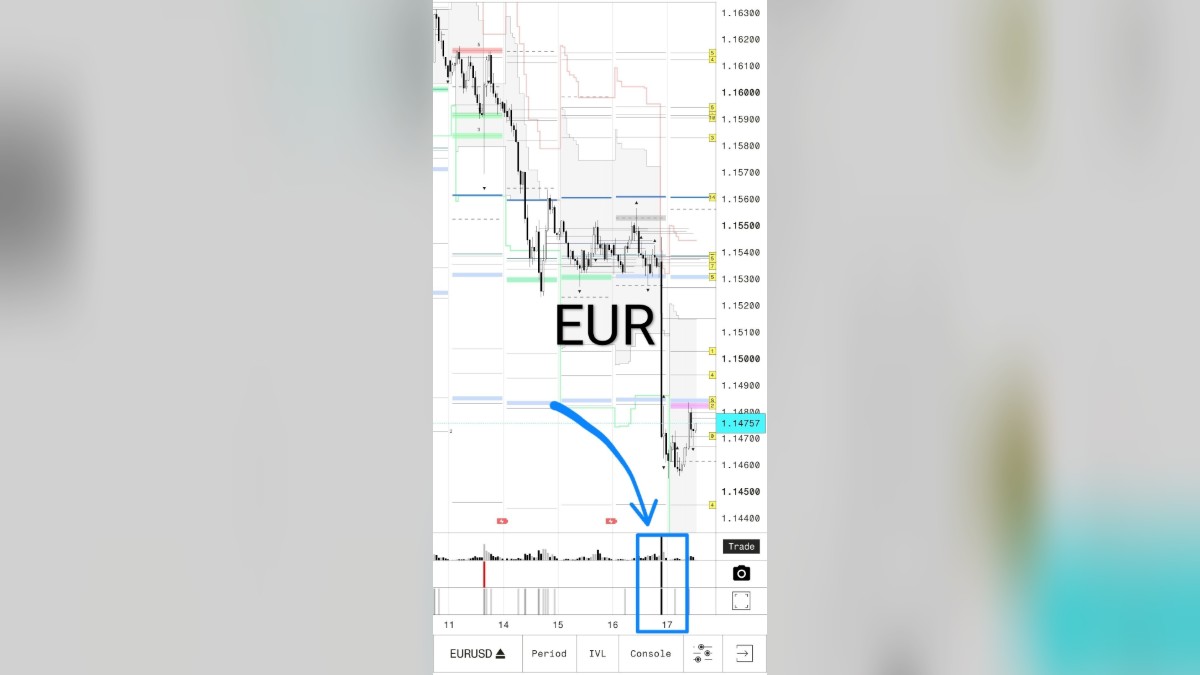
Liquidity is spread unevenly across the chart: orders concentrate in specific price zones, and those zones form the levels.
A liquidity level is a price mark built on the edge of a local high or low. It's a spot where buyers and sellers had a significant clash in the past.
Resistance (R): a level built on local highs. This is where sellers previously took control and stopped price from moving higher.
Support (S): a level built on local lows. This is where buyers previously held price from falling and reversed it back up.
How this works in UniqUnits:
These levels are built automatically and marked with blue lines labeled R and S. It's the "skeleton" of the market, the foundation for all further analysis.
Track the data flow and real-time liquidity reaction through our app: