It really comes down to one simple question: can you execute a trade quickly, at a price close to what you see on screen?
Liquidity comes down to three factors:
Speed and spread — how fast your order fills, and how small the gap is between the buy and sell price (Bid/Ask)
Market depth — how much volume sits in the order book at current prices
Price impact — how much your own order moves the price and causes slippage
What's the difference in practice?
On a liquid market, all these factors work in your favor: trades fill instantly, spreads stay tight, and risk is predictable.
On an illiquid market, the exact same action can cost you significantly more, thanks to a thin order book and heavy slippage.
Which raises the question: what are you actually looking at on your chart?
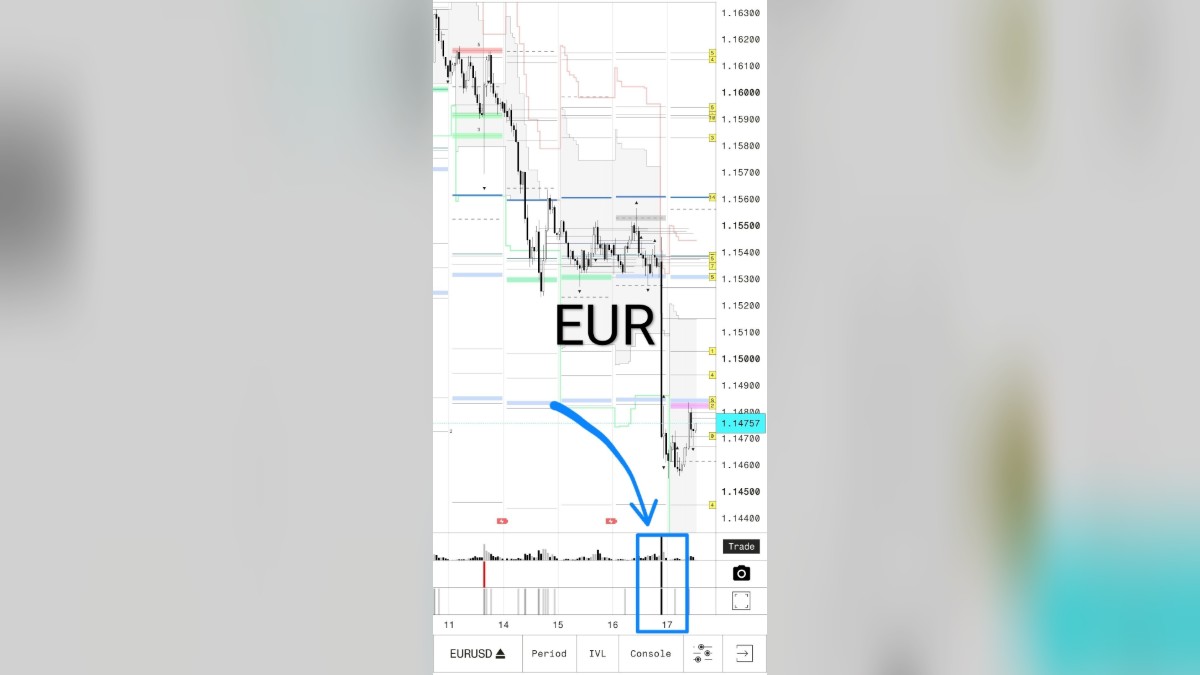
A standard CFD chart mostly shows you price. UniqUnits adds real volume and liquidity levels on top of that, calculated from CME futures market data.
That means alongside where price is going, you also see what's happening with volume and liquidity behind that move.
Track the data flow and real-time liquidity reaction through our app: