Different brokers can show different daily extremes. The reason comes down to quotes: every broker forms its own.
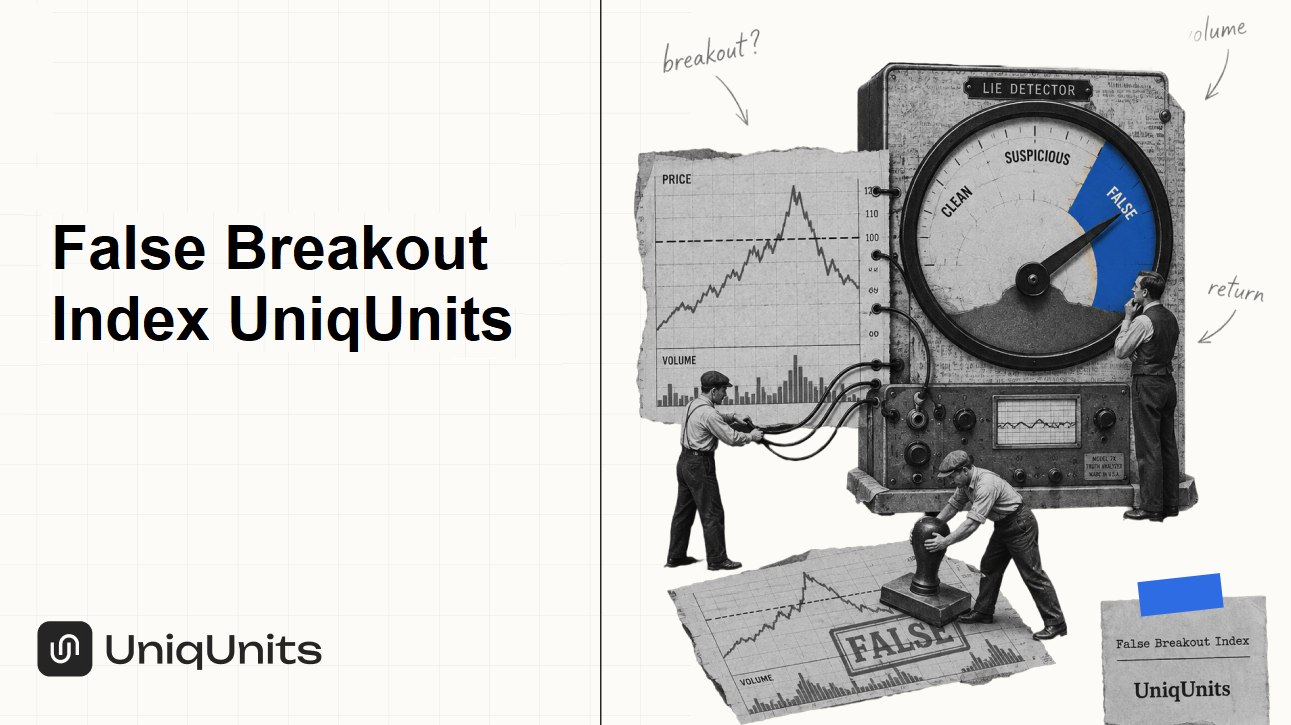
That creates a gap in signals. On one broker's chart, price breaks above yesterday's high and comes back, a false breakout confirmed. On another broker's chart, price never even reaches that level. Same asset, same hour, different outcome.
Why we're tracking this
We built this index to make a simple point: signal quality doesn't depend on your methodology alone. Even with the right analysis model, a trader can end up with a distorted picture if a broker's daily extremes diverge from the exchange's.
CME Group futures data is the same for every market participant. It's an objective reference point that doesn't depend on any specific broker.
How we calculate it
For each broker, we compare their recorded false breakouts on the previous day's extreme against CME data for the same period. We calculate the share of cases where the broker's signal matched CME's. The result is a value from 0 to 1.00, the closer to 1.00, the more accurately that broker's false breakouts line up with exchange data.
The index updates every Sunday.
Track the data flow and real-time liquidity reaction through our app: