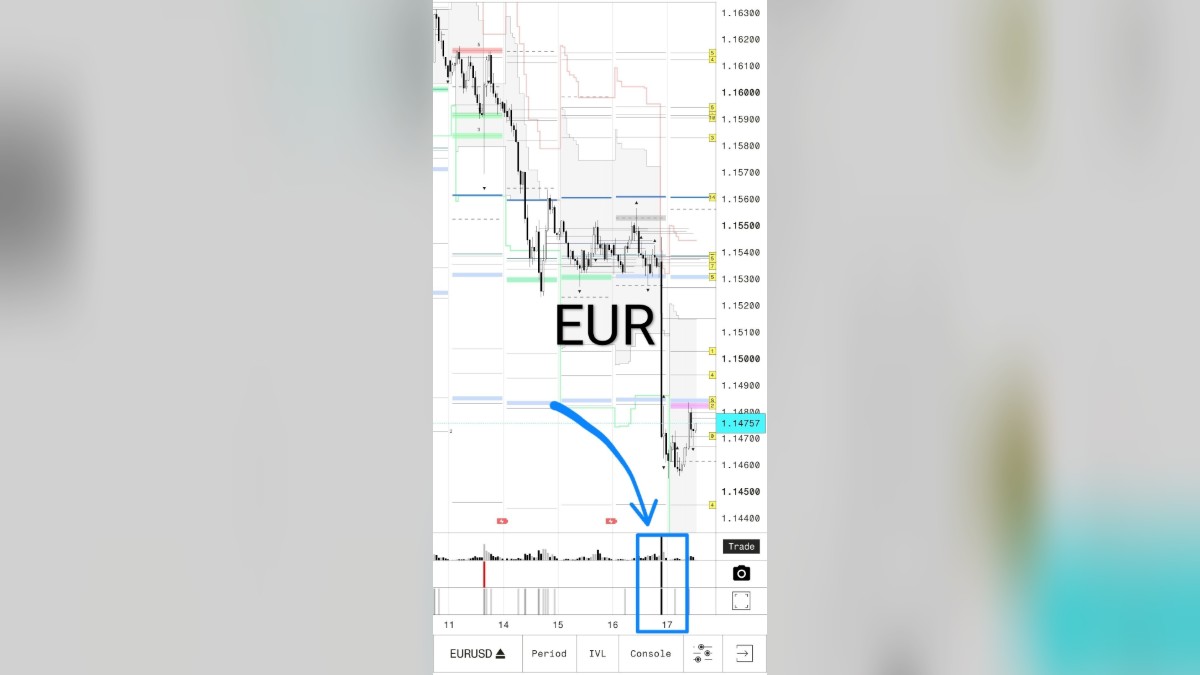
If you look closely at the UniqUnits chart, liquidity levels are drawn as clean segments tied to individual trading days. There's a technical reason for that.
Segments are the only honest way to bring CME exchange data onto a CFD chart.
What makes translating CME to CFD so tricky?
Different price sources — futures and CFD broker quotes never match exactly, because of differences in spreads and how prices are formed
Expiration shifts — futures regularly roll from one contract to the next, which creates price gaps
How UniqUnits solves this:
The app recalculates levels daily, re-mapping futures levels onto your CFD chart every day and clearing out the accumulated error.
In practice, that means:
Accurate identification of real reversal zones on your chart
Less distortion between futures and CFD quotes
A structure grounded in objective exchange data
Track the data flow and real-time liquidity reaction through our app: